
Contour Detection#
DataLab provides a “Contour Detection” feature which is based on the marching cubes algorithm.
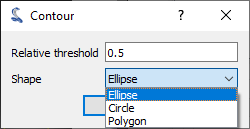
Contour detection parameters.#
- How to use the feature:
Create or open an image in DataLab workspace
Eventually create a ROI around the target area
Select “Contour detection” in “Analysis” menu
Enter parameter “Shape” (“Ellipse”, “Circle” or “Polygon”)
Optionally, enable “Create regions of interest” to automatically create ROIs around each detected contour:
Choose ROI geometry: “Rectangle” or “Circle”
ROI size is automatically calculated based on the minimum distance between detected contours (to avoid overlap)
This feature requires at least 2 detected contours
Created ROIs can be useful for subsequent processing on each contour area
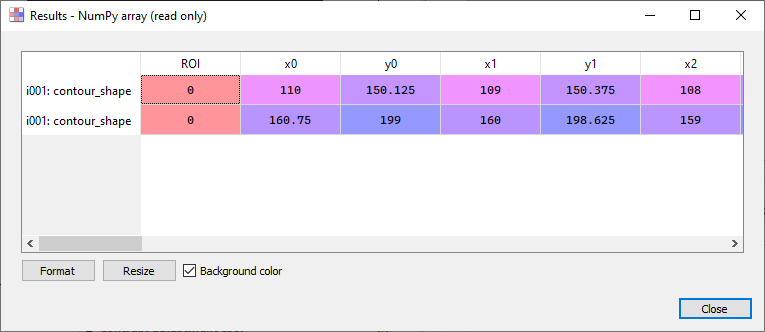
Contour detection results (see test “contour_app.py”)#
- Results are shown in a table:
Each row is associated to a contour
First column shows the ROI index (0 if no ROI is defined on input image)
Other columns show contour coordinates: 4 columns for circles (coordinates of diameter), 8 columns for ellipses (coordinates of diameters)
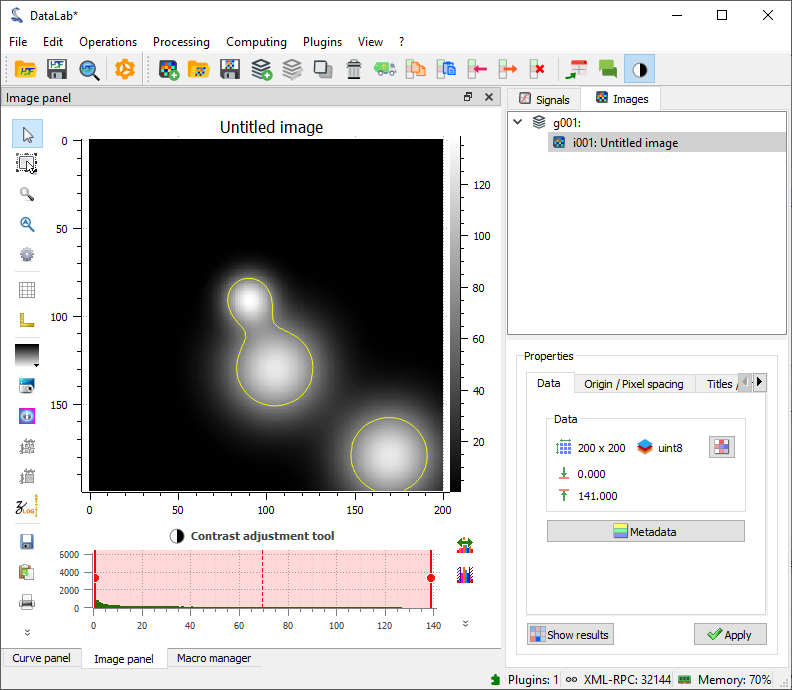
Example of contour detection.#
- The contour detection algorithm works in the following way:
First, iso-valued contours are computed (implementation based on skimage.measure.find_contours.find_contours)
Then, each contour is fitted to the closest ellipse (or circle)
Feature is based on get_contour_shapes function from sigima.tools module: